Ascending Aorta & Aortic Valve
A deep dive into the careful assessment of these two dovetailed entities with all aspects of Internal Medicine POCUS (Acquisition, Identification, Interpretation, and Clinical Integration)
This chapter concerns diseases that are frequent in clinic patients. The advanced IMBUS physician can offer these patients improved care, less resource use, and increased patient satisfaction. The danger lies in being only mediocre. These exam techniques and measures must be routinely performed to gain and maintain the skill.
ASCENDING AORTA
IMBUS cannot see all parts of the ascending aorta. The best views for imaging are a cephalad PLAX, apical3, apical5, and SC5. The difference in aorta size between systole and diastole is slight, so get the sharpest image of the ascending aorta and freeze to measure. Enlarged ascending aortas are usually spotted immediately with the eyeball method, but it takes experience measuring aortas to develop this ability. With bicuspid aortic valves, only the beginning portion of the proximal aorta may be aneurysmal. Still, the most common aneurysms do not involve this portion but have dilation beginning about 3 cm distal to the annulus at the sinotubular junction. When measurement is made increasingly distal in the ascending aorta, the ultrasound plane may be more oblique and give falsely high numbers. The aortic arch is difficult to see in elderly patients, but aneurysms isolated to this area are rare.
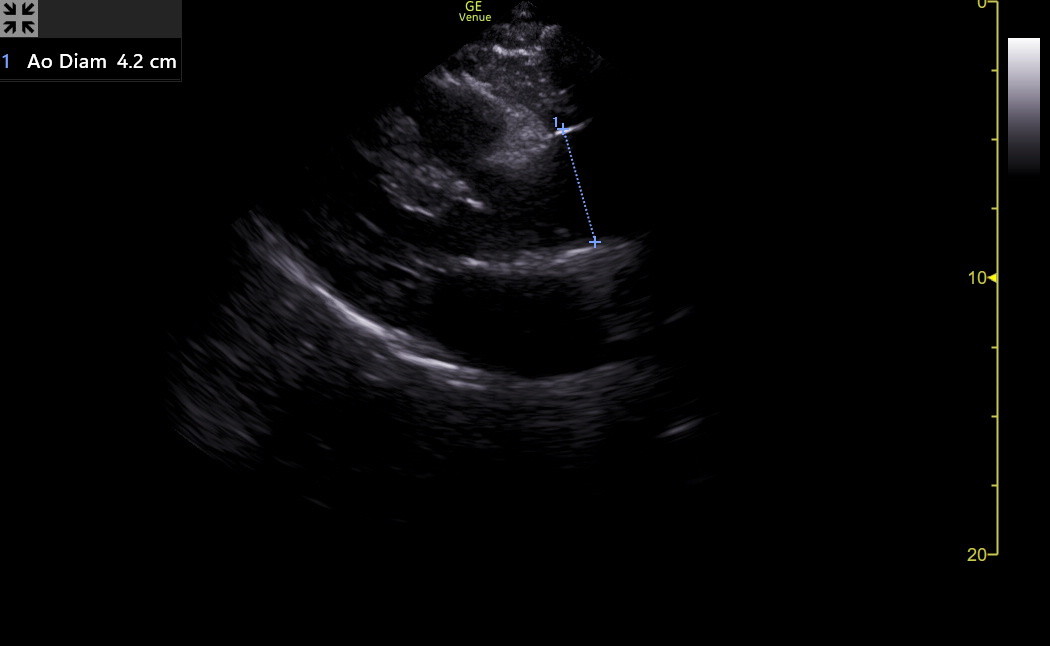
We use the “leading edge to leading edge” (LELE) method for measuring, as was done with the abdominal aorta. Measuring methods vary between labs, so expect variations of some millimeters between different measurements. LELE means the first caliper goes at the start of the hyperechoic anterior wall, and the second caliper goes at the beginning of the posterior wall (end of the lumen). Even with only fair views, the aorta walls are echogenic and can be measured. Usually, just the ascending aorta is measured unless the beginning aortic sinus looks bigger. Here is a typical PLAX that allowed an excellent aorta measurement larger than normal.
Here is a clip of a patient’s PLAX with a proximal aorta larger than the RVOT or the left atrium.
The diameter of this aorta was 4.0 cm, but a patient’s height must be considered when interpreting the aorta size. This woman was only 61 inches tall, so her physician was appropriately worried. Overall, aortic rupture is rare under 4 cm in average-sized adults. Aortic dissection can occur at any size. The following table shows the upper normal values for the aorta location, with the value for females first, followed by the male.
Sinus of Valsalva |
Ascending Aorta |
Descending aorta |
|
Aorta diameter (cm) |
3.4, 4.0 |
3.6, 4.0 |
2.6, 2.9 |
The descending aorta in the short axis can often be seen, although not consistently well, in the PLAX (below the left atrium) and apical4 (below the lateral LA). Fortunately, enlarged descending aortas rarely occur in isolation from the ascending, and an enlarged descending aorta is easier to see and measure. If an apical2 is fanned medial with modest increased depth, the long-axis descending aorta may be seen below the heart. This can show dilation, dissection, or thrombus. Here is a modified apical2 showing the long axis descending aorta below the left atrium.
The supra-sternal view of the aortic arch is challenging and increasingly fails in elderly patients. Fortunately, the arch rarely enlarges in isolation, so this view and measurement are not part of the IMBUS exam.
AORTIC STENOSIS (AS)
Under-estimating severe aortic stenosis is an increasingly grave mistake as the ability to correct AS continues to improve. The rate of AS progression is unpredictable, and patient symptoms are not reliable for indicating severe disease. Unfortunately, even expert echocardiographers, using just visual estimation of AS severity, had a sensitivity of only 60% and a specificity of 85% for severe AS compared to a Doppler evaluation (Quader et al. J Ultrasound Med, 2015).
NOTE: The rest of this section focuses on measuring aortic valve (AV) flow, but standard B-mode observations and measurements are still crucial for AV analysis. Careful assessment for IVS hypertrophy, LV diastolic dysfunction, LV longitudinal systolic dysfunction, and LA enlargement is essential. A patient who lacks all these abnormalities would not have severe AS. This is important in those patients in whom the measurements of AV flow are suboptimal or impossible.
Most clinic AS patients are older with calcification of tri-leaflet aortic valves. In these patients, the severe AS is accompanied by severe sclerosis/calcification of the valve. Thus, observing only modest sclerosis of the AV in an elderly patient markedly lessens the chance of severe AS. However, severe calcification does not always mean severe AS. Here is a PLAX clip of a patient with prominent thickening and sclerosis/calcification of the AV, along with some restriction to the opening of the valve. However, this alone can’t determine the severity of the AS.
Sometimes, the hyperechogenicity of a calcified aortic valve makes it difficult to see the valve leaflet movement. Experts suggest using TGC to decrease the gain over the valve to visualize leaflet movement better.
Bicuspid AV disease is different in several ways. First, such patients develop trouble at an earlier age. Second, they can progress to AS without severe calcification. Third, they are more likely to acquire proximal aorta dilation at an early phase of the disease. Thus, these patients need to be followed regularly from an earlier age, focusing on the AV and the aorta.
Distinguishing a bicuspid (or even unicuspid or quadracuspid) AV from a tri-leaflet valve is often challenging, partly because the views of the valve in the upper PSAX may not be clear. Even with clear views, some bicuspid valves can appear tri-leaflet. We should always confirm a possible bicuspid valve with formal echocardiography. A bicuspid valve's fish mouth can be oriented in various ways in the aorta. Here is a confirmed bicuspid aortic valve in the upper PSAX.
In contrast, here is a tri-leaflet aortic valve in PSAX in a younger patient with a family history of bi-leaflet valves. Slow-motion playback was very helpful in determining that each leaflet opened and coapted well.
ADVANCED TIP: When it is essential to see the AV leaflets, but the PSAX view is suboptimal, a cross-sectional AV view can sometimes be found in the SCSAX. The following view was better than the PSAX in the patient. The orientation of the leaflets is rotated about 90 degrees clockwise compared to the PSAX, but three modestly sclerotic leaflets are seen to open fully.
No single ultrasound measurement reliably estimates AS severity. Valve area calculations are time-consuming and more prone to error than many realize (see the discussion at the end of this section). We need Doppler flow velocities, and measuring only peak velocities is adequate (Finegold et al., International Journal of Cardiology, 2013).
One essential peak velocity is right after the aortic valve (AV Vmax). Because this post-valve velocity is > 2 m/sec in aortic stenosis, continuous wave Doppler (CW) is used. However, the CW gate line should be as parallel as possible to the blood flow, or the velocity will be underestimated. The apical5 view, particularly with some RV enhancement, is likely to be close to parallel. The apical3 view may give even better tracings and measurements, so it should also be attempted in patients suspected of AS. If the left ventricular outflow tract (LVOT) is 30 degrees or less off-parallel to the default CW gate line, angle correction on Venue will allow an accurate estimate of AV Vmax. Here is an acceptable apical5 view for measurement.
With the AV and LVOT positioned, activate Color and find the anterior/posterior plane that maximizes the flow through the AV. Then, place the CW line with the area of interest right after the AV opening, activate it, and angle-correct to parallel the flow. Here is a tracing from a patient with mild AS. The sharp, hyperechoic line at the end of the envelope is the closing valve “click” of the AV, which is unavoidable with CW.
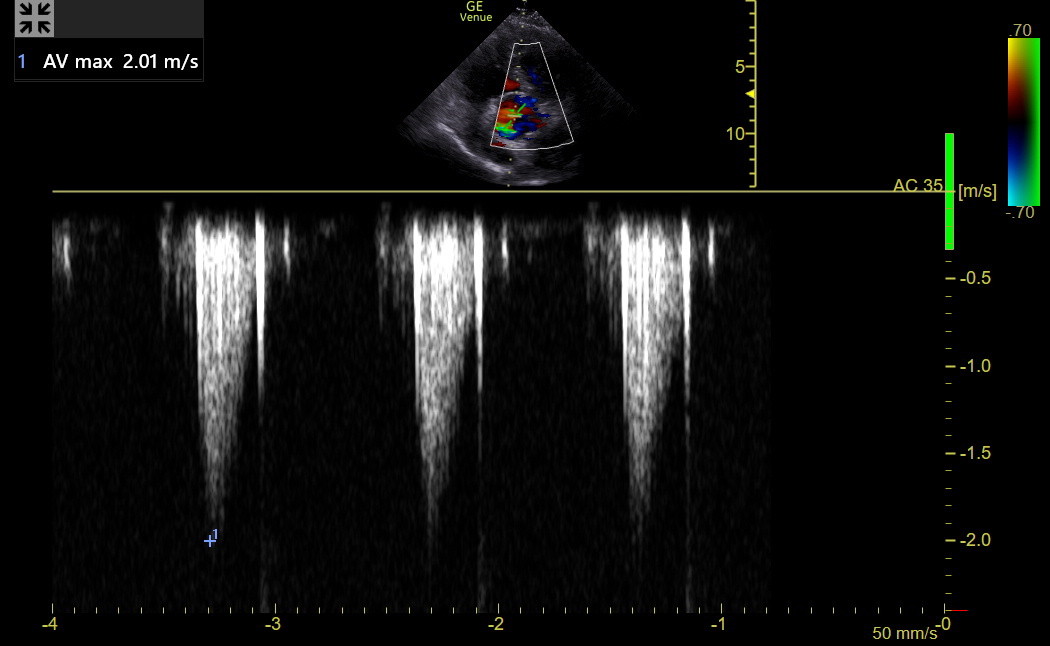
The flow through the outflow tract and valve shows below the line because it is going away from the probe, so the baseline should be moved up. Adjust the complex size to occupy most of the graph. Then, freeze the tracing in later expiration and measure the lowest point on the curve/spectrum, AV Vmax. Don’t measure a poor spectrum. Experts suggest measuring spectral Doppler tracings closer to the well-defined “chin” and not to the last faint “tip of a beard,” The same principle applies to tracings above the baseline.
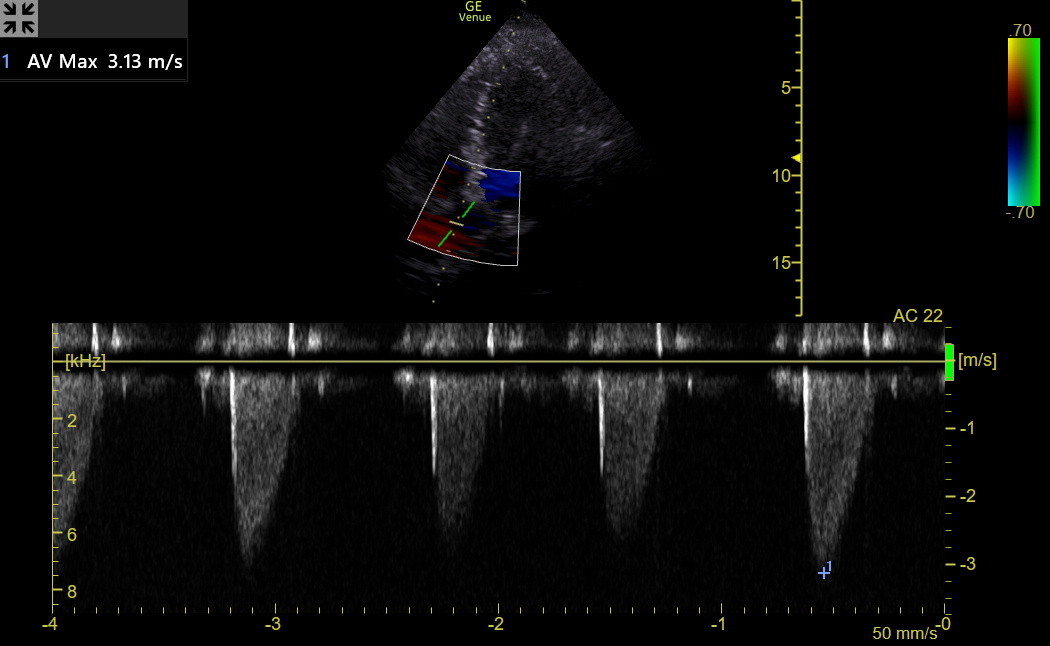
Next is a tracing from a patient with moderate AS. The spectrum is clear, and the AV Vmax was 3.1 m/sec. The sharp spike at the beginning of the envelope is an opening valve click.
In many patients, the AV Vmax alone could be used to categorize the severity of AS, as in the following table.
Post AV CW (m/sec) |
Severity |
< 2 |
No AS |
2-3 |
Mild AS |
3-4 |
Mod AS |
4-5 |
Severe AS |
Dimensionless Index: Unfortunately, AV Vmax can be misleading. This happens in patients with either reduced stroke volume (low flow/low gradient AS) or increased stroke volume (including patients with ≥ moderate AR). To avoid these traps, look at the ratio of LVOT Vmax to AV Vmax. This is called the dimensionless index (DI).
Occasionally, the orientation of the CW line will be parallel through the LVOT and the AV, and the spectrum may then show separate AV Vmax and LVOT Vmax in the same tracing. Here is a spectrum in a clinic patient with mild AS and a calculated dimensionless index of 0.53.
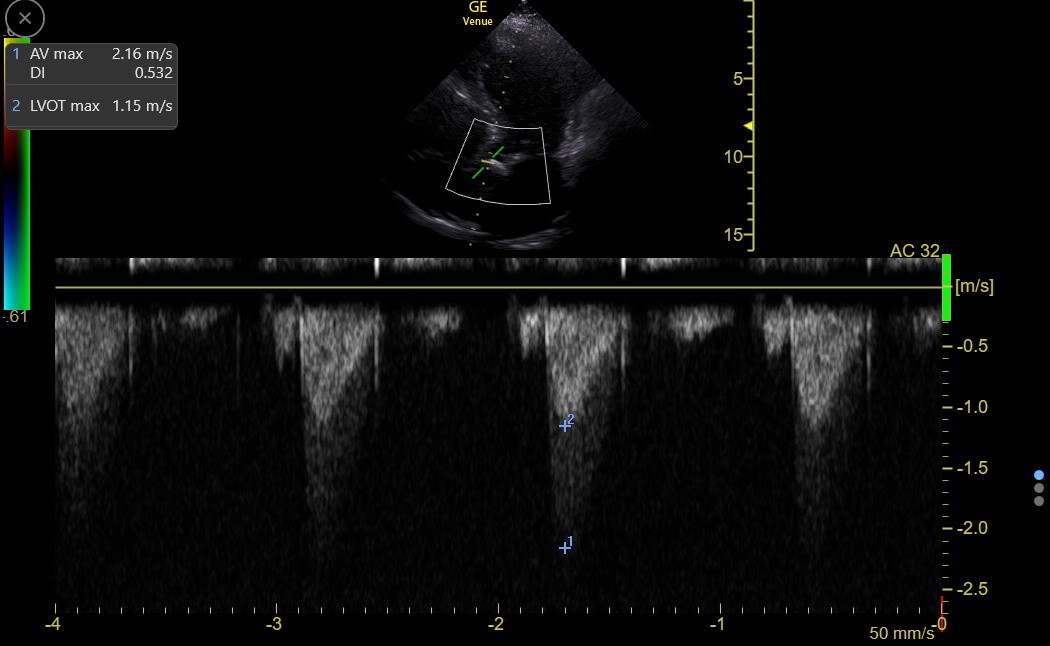
However, this embedded LVOT velocity curve should be used cautiously because it includes the turbulent flow immediately proximal to the stenosis, making the LVOT Vmax falsely high. This would increase the DI, causing an underestimation of the severity of AS. We should use PW to measure LVOT Vmax separately, orienting the gate parallel to the flow and putting it away from the valve enough to avoid valve clicks in the tracing. Here is the LVOT Vmax in the previous patient; the DI was 0.36. The DI is interpreted in the following table.

AV Dimensionless Index |
|
1 |
No AS |
Down to 0.5 |
Mild AS |
0.5 - 0.3 |
Moderate AS |
0.25 |
Severe AS |
Studies have shown that the LVOT Vmax needs to be obtained in the correct position and at the same expiration phase as the AV Vmax, or a meaningful error in the DI will result.
OVERALL APPROACH TO AS: With a first diagnosis of AS in an older clinic patient with a sclerotic/calcified valve, a formal echo may not be needed if the views are good and all evidence points to non-severe disease. Any equivocal finding mandates a formal echo. Patients can be followed in the clinic at decreasing intervals as AS progresses beyond mild, watching for a meaningful lowering of the dimensionless index and apparent change in septal hypertrophy, LV diastolic or longitudinal function, or LA size. Formal echo and valve center referrals are needed when anything suggests a disease greater than moderate. The criteria for replacing the AV in AS are evolving, and missing AS worsening could be harmful.
AORTIC VALVE AREA (AVA): Our colleagues periodically ask us if we can determine a patient’s AVA, and our answer should be, “We can, but we don’t need to. The Dimensionless Index tells us what we need to know”. The AVA calculation uses the Dimensionless Index and the estimated area of the LVOT right before the AV in the following equation:
AVA cm2 = (Cross-sectional area of the aorta at the valve) x Dimensionless Index
A fundamental assumption of this method is that a normal AV will have an area equivalent to the circular area of the aorta at the valve. Unfortunately, the assumption of circularity is wrong in some patients, and experts disagree about where to measure the radius that calculates the circle. The agreement of the radius measurement between different examiners has also been suboptimal. Thus, the calculated normal valve area is a problem.
In the formal echo lab, the DI for this calculation is usually obtained using mean velocities from the velocity time integral (VTI) of the Doppler tracings. There should be no meaningful difference in the DI calculated using mean and maximum velocities. However, tracing the VTI introduces errors, and the Vmax values have been more reproducible over time with better agreement between different examiners.
The AVA also varies with a patient's size, so the calculated AVA can only be helpful if it is indexed for height. In contrast, the DI does not change with patient size. Unfortunately, many physicians learn absolute AVA numbers and incorrectly assume that a 1 cm2 AVA means the same thing for all patients.
The DI alone categorizes stenosis on the mild to critical spectrum, and by being a ratio, it is robust to changes in body size and stroke volume. The DI obtained from well-performed AV Vmax and LVOT Vmax values is all the IMBUS physician needs to make decisions. Valve centers need absolute AVA numbers as they plan for AV replacements because they need to implant devices of the correct size. The absolute AVA from a transthoracic echo is in this analysis. However, it is only part of what centers use because they know the errors inherent in the AVA calculation.
AORTIC REGURGITATION (AR)
AR is common and important, but sometimes difficult to assess for severity. There isn’t a specific measurement, either caliper or spectral Doppler, to reliably determine if AR is severe. Color and other B-mode information are used to assess severity. Substantial AR should have a hyper-dynamic LV; worry begins when the LV dilates with decreased longitudinal systolic function. AR should be corrected before the EF decreases. An increase in LA size is also a warning sign.
The first evidence of AR may be fluttering of the anterior leaflet of the mitral valve in the PLAX. The fluttering may be subtle or prominent and indicates a partially eccentric jet. Here is a clip of the PLAX of a bicuspid AV patient with subtle anterior leaflet fluttering. There is also some sclerosis of the AV and at least mild restriction in AV opening.
When the AR jet impinges strongly on the mitral leaflet, it can restrict its opening. This might be seen with an M-mode tracing across the anterior MV leaflet. This pathology is one theory of what causes the traditional Flint murmur of AR, a diastolic low-pitched rumble, like mitral stenosis.
Color analysis of AR requires an optimal size of the Color sector box. The sector must extend from a little distal to the valve on the aorta side through the outflow tract. An excessively tall Color sector box can over-alias the regurgitant jet. Here is a Color sector that is appropriately wide for a patient’s moderate AR, but the height should have been reduced by about 50%.
The AR jet is assessed with Color in the PLAX, apical5, and apical3. Eccentric jets are particularly difficult to assess, and tachycardia makes things more challenging. Sometimes, the width and length of the AR jet can help categorize, but there are problems with this.
ALIASING: This is used when a Doppler signal has exceeded the Nyquist limits set for the exam type. With Color, this helps our interpretation. If we see a uniform light blue or light red color without any mosaic of colors, the flow velocity in the view is low in the direction being studied. With high velocities, we see a mosaic of mixed colors.
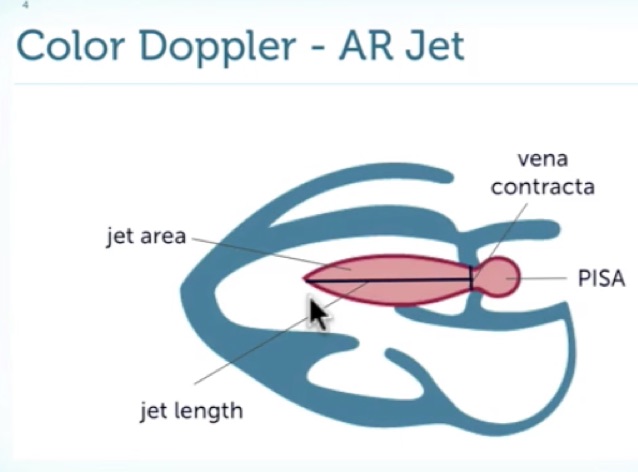
More important than the width and length of the AR jet are the characteristics of the jet’s origin. It is essential to optimize the image before looking at the jet (sometimes frame by frame). Look for the presence and size of a flow convergence zone, which is the ball of color that appears at the start of the jet on the aortic side of the valve. Also, look at the width of the narrowest portion of the jet, called the vena contracta, as it comes through the valve. Here is a diagram from 123sonography representing the characteristics of an AR jet.
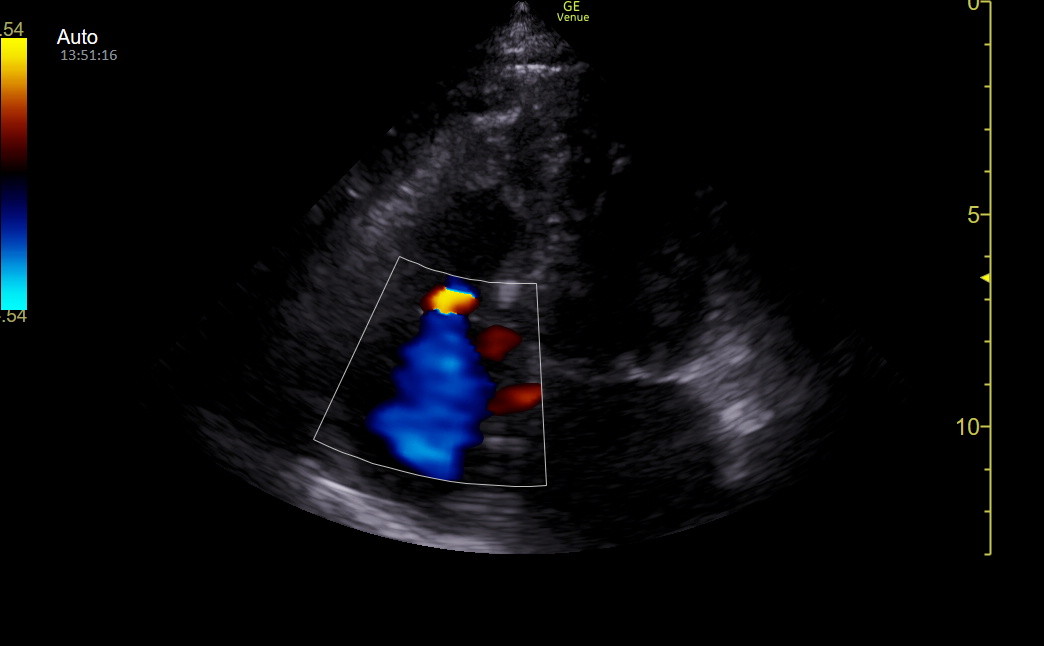
The following Venue frame is from a tricuspid regurgitation patient but nicely shows a convergence zone.
This table shows how the characteristics of the AR jet are used to determine the severity of the lesion. The jet width refers to the percentage of the outflow tract it occupies.
AR Severity |
Jet width |
Flow convergence |
Vena contracta |
Mild |
< 25% |
Not visible |
thin |
Moderate |
25-65% |
Small |
medium |
Severe |
> 65% |
Large |
wide |
Coanda effect: Eccentric, regurgitant jets that hug walls create something called the Coanda effect, which makes it hard to estimate the severity of the AR by jet length and width. Here is an apical4 that was initially misleading because a red jet was seen going towards the apex of the heart in diastole but arising about mid-ventricle.
When the view was moved to an apical5, it could be seen that this was an AR jet hugging the septum and then curving into the ventricle.
Here is a clip from a patient with severe AR. The apical3 gave the best view of the jet. The flow convergence zone is prominent, the vena contracta is wide, and the jet is wide, long, and strongly aliased.
Approach to AR: AR causes volume stress on the LV. Correction is indicated for AR when the ventricle begins to dilate, and LV longitudinal function declines to mid or low normal. The LVEDD, LV end-diastolic volume from real-time EF, s’, and LA size must be carefully watched. The LV size measurements are often underestimated, so the change over time may be more important than the absolute numbers. The severity of the AR jet itself can vary as a patient’s preload, afterload, and contractile state vary. When the LVEDD increases to upper normal for height, LV longitudinal function decreases, or the LA begins to enlarge with sinus rhythm, a formal echo is needed to be sure an AR patient is corrected at the optimal time.