Atrial Size and Function
An overview of the often-overlooked atrial anatomy and measurements important for Internal Medicine POCUS
LEFT ATRIAL SIZE
Left atrial size has been called the “hemoglobin A1c of left heart function,” but eyeballing atrial size is an acquired skill that requires many repetitions, during which the eye is correlated with some measurements. Both atria have complicated shapes; no single view gives an accurate size estimate. As a result, echocardiography underestimates atrial volume compared to volumetric MR measurement.
Knowledge of the tributaries to the LA and RA helps us determine where the atria end for area measurements and explains some of their Color patterns. The video below provides a quick overview of the anatomic entrance of the four pulmonary veins into the left atrium and the entrance locales of the IVC and SVC into the RA.
While rotating from an apical4 to an apical2 view, it is possible to see the left atrial appendage below the anterior mitral valve as the pulmonary veins fade away. Thrombus can be seen in the appendage in atrial fibrillation. An enlarged atrial appendage is easier to see than a normal one. The following shows a normal LA appendage just as the apical2 was achieved.
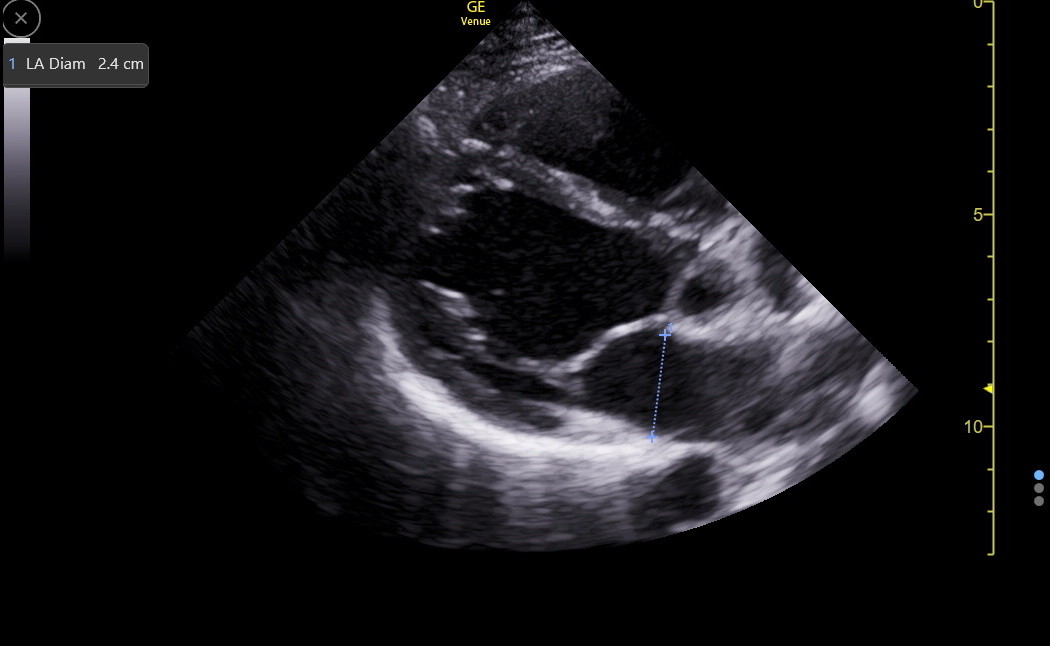
In the PLAX, the LA diameter at the end of LV systole (maximal LA size) at the level of, and parallel to, the aortic valve is an old measurement with only 50% sensitivity for LA enlargement because the sternum and spine constrain the anterior-posterior expansion of the atria; most atrial enlargement occurs in the cephalad/caudad and lateral dimensions. This measurement should only be made when the LA appears enlarged in a patient with poor apical and subcostal windows. The LA diameter varies with patient height but will be < 4.0 cm in most normal adults. Here is an image of the PLAX LA diameter in a normal patient.
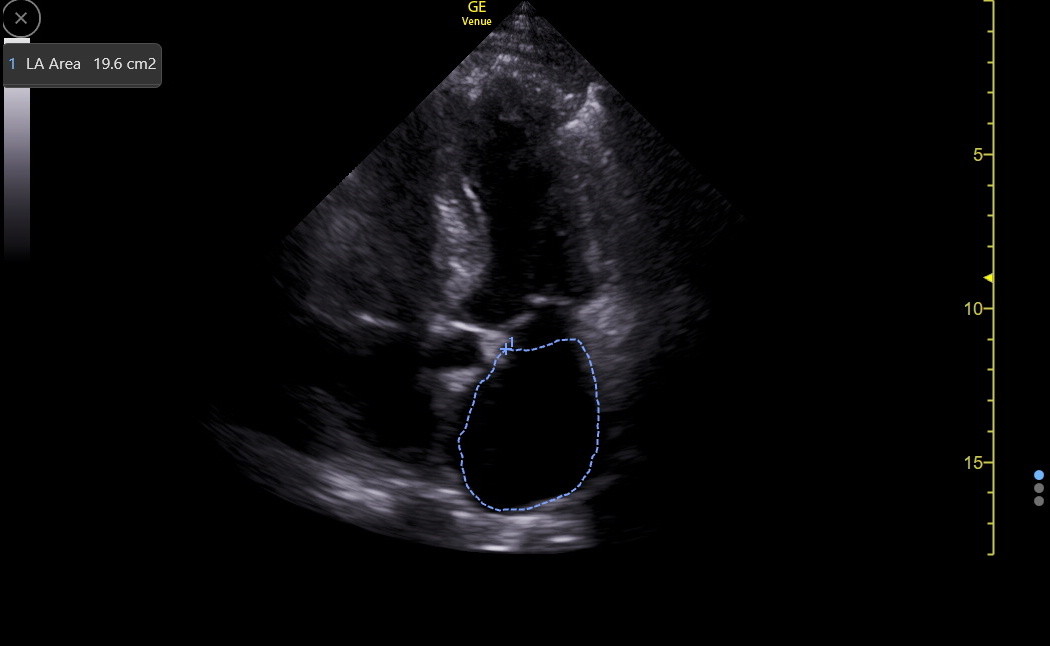
When the apical4 view is good, the LA area is our most robust size measurement. The subcostal4 views can also be excellent for this. Get the best view of the LA, freeze the image, find the maximum size, and then use the device method for measuring area. The normal area for an adult of average size will be under 20 cm2. Here is an example of LA area measurement.
The following table gives the size ranges for increasing degrees of LA enlargement.
Atrial Size Reference |
Normal |
Mild |
Moderate |
Severe |
LA Width, PLAX (cm) |
2.7 - 4.0 |
3.9 - 4.6 |
4.3 - 5.2 |
≥ 4.7-5.3 |
LA Area, apical4 (cm2) |
< 20 |
20 - 30 |
30 - 40 |
> 40 |
ATRIAL SEPTAL ANEURYSM
An atrial septal aneurysm is found in 1-3% of the American population and can be congenital or acquired. When LA pressure exceeds RA pressure (normal), the aneurysm bulges into the RA. If RA pressure is higher, the bulge can be into the LA. Most of these aneurysms are asymptomatic but can be associated with a patent foramen ovale, an atrial septal defect, and atrial arrythmias. The following clinic patient was a younger woman with atrial flutter.
ATRIAL FUNCTION
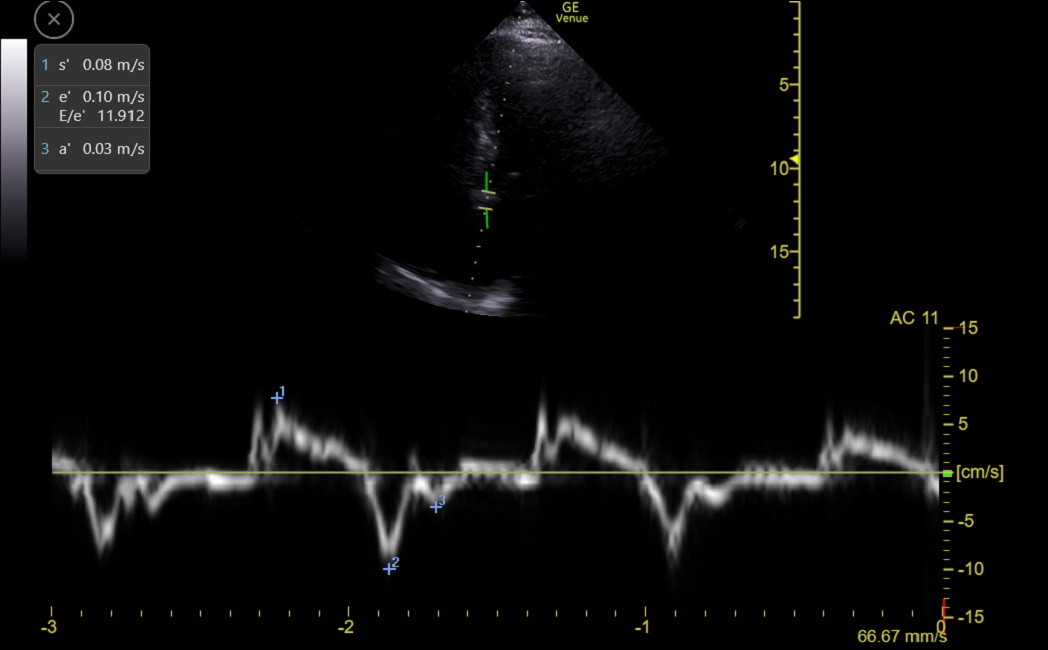
The left and right atria have function, which is lost in atrial fibrillation and decreased in other situations. The a’ velocity from TDI analysis of the MV and TV annulus are our best measures of atrial function. A pressure load on the atria may be more harmful to function than a volume load, and various causes of heart failure with preserved ejection fraction, including infiltrative diseases, can reduce atrial function. Patients receiving ablative therapy for atrial fibrillation frequently have reduced LA function that can last for months.
The following clinic patient was about ten days after an atrial fibrillation ablation procedure, and the MV septal TDI showed an abnormally small a’.
DOPPLER ANALYSIS OF LV INFLOW
LV Inflow from the LA through the mitral valve can be measured with spectral Doppler to get the maximum velocity of the E-wave (early diastolic inflow caused by the suction/pull of LV diastolic function and the push of LA pressure) and the A-wave (late diastolic inflow from atrial contraction). These velocities are usually maximum near the tips of the open mitral valve leaflets at end-expiration. The E and A waves are essential for assessing atrial function and pressure.
Step 1: Get an apical4 with the IVS roughly vertical and both mitral valve leaflets in view.
Step 2: Activate Color: optimize the sector box for the LV inflow area and fan the probe anterior and posterior to find the plane with maximum intensity of the inflow signal (red flush) during expiration. Measurements must be parallel to flow and lateral to the blue LVOT signal in this red flush. Here is a good example:
Step 3: Measure the velocities of LV inflow: The LV inflow “red flush” identifies the optimum position right-to-left on the screen to place the Doppler gate. However, finding the optimum position from top to bottom in the LV can be a challenge.
Many centers do the LV inflow velocity measurements with PW because they measure a detail in the E wave that is now less useful. With PW, the examiner must carefully explore the area above the MV to find the maximum velocities. Expect about 10% lower E velocities when measured with PW.
Continuous wave Doppler (CW) is better at finding the maximal velocities because it measures all along the gate line and displays the maximum velocities wherever they occur. Studies have shown that routinely obtained CW E velocities are often up to 10% higher than routine PW velocities. Several echocardiographic societies support using CW when the goal is finding maximal velocities, which is our practice. It is easier with Venue to use PW to position the gate and get it parallel in the red flush near the tips of the open MC. Then, activate CW with two taps to get the final tracing.
The sweep speed should be adjusted with fingers so that only 3-4 heart cycles are seen per screen, or important details may be missed. A live B-mode image can be turned on at the top of the screen with the Simult button, which can help with final gate placement. However, the final CW tracing is better when Simult is turned off.
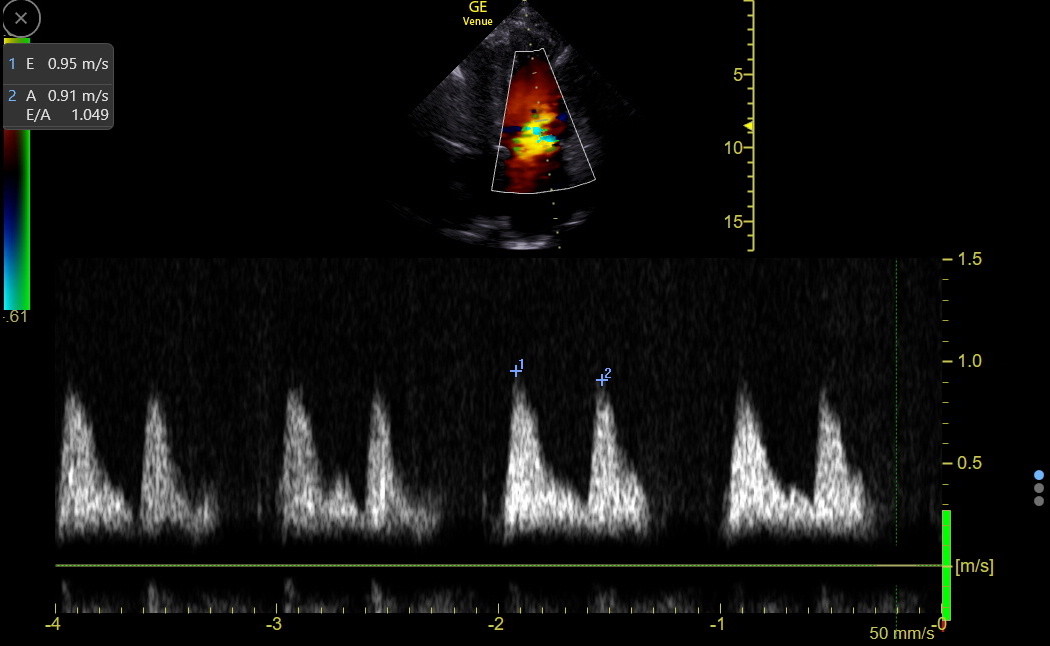
Freeze the tracing at the end of expiration and measure the complex with the maximum and clearest E wave. Here is a normal CW tracing with measured E and A waves (Venue calculated the E/A ratio).
Every advanced IMBUS physician has at least once confused E and A. The live B-mode tracing and the Doppler sound help with this distinction, and mitral regurgitation nicely identifies systole on the tracing. However, the TDI tracing is a big help since there is no confusion between e’ and a’. Use a piece of paper and mark the distance between e’ and a’ on the paper. Return to the CW tracing and match the e’-a’ interval with the correct pair of waves to correctly identify E and A.
Normal E velocities are between 0.5 and 1.25 m/sec. Higher-than-normal E waves in our patients are almost always caused by increased push from elevated LAP. Still, a rare, well-trained endurance athlete can have increased pull from enhanced diastolic function as a cause. An important misleading cause of an elevated E wave is ≥ moderate aortic regurgitation. In this condition, the complex hemodynamics in the LV may produce a sharp initial high E wave with rapid decay, and this E does not accurately reflect LAP.
Lower-than-normal E-wave velocities (not due to poor gate position) are caused by reduced push from low LAP or reduced pull from decreased LV diastolic function.
E-waves vary more than A-waves with changes in LA pressure and LV function, so the E/A ratio is dynamic. E, A, and E/A vary substantially with age. The following table shows a metanalysis's weighted mean values (m/sec). The E velocity falls because LV diastolic function/suction usually decreases with age, and the A velocity increases as there is more dependence on the atrial contraction to empty the increased residual volume in the left atrium. An A wave that is abnormally low for age should raise the suspicion of LA dysfunction unless both E and A are reduced because LAP is low.
LV Inflow |
20-29 yr |
30-39 yr |
40 - 49 yr |
50-59 yr |
60-69 yr |
70-79 yr |
80-89 yr |
E |
0.83 |
0.78 |
0.73 |
0.67 |
0.67 |
0.66 |
0.64 |
A |
0.45 |
0.51 |
0.55 |
0.61 |
0.71 |
0.78 |
0.90 |
E/A |
1.91 |
1.56 |
1.37 |
1.16 |
0.99 |
0.87 |
0.73 |
LEFT ATRIAL PRESSURE
Left atrial pressure (LAP) is an important parameter. Ultrasound can categorize this pressure using the E velocity and mitral annulus tissue Doppler e’ velocity. The E/e’ ratio can be thought of as removing the pull of diastolic function from E, giving a number that reflects the push of LAP. E and e’ must be carefully obtained at the same end-expiration phase to avoid errors. With CW-measured E values, septal E/e’ ratios ≤ 10 indicate normal to low LAP, while ratios > 15 indicate increasing LAP. With lateral e’ measurements, E/e’ ratios ≤ 8 indicate normal to low LAP, and ratios > 13 indicate increasing LAP. Values between the lower and upper cutoffs must be interpreted considering other heart findings. E/e’ will be discussed further in the chapter on LV failure and LAP.
RIGHT ATRIAL SIZE
RA size is primarily measured in the apical4 and SC4, but we can visually assess the RA in the PLAXR and apical3R. A normal RA in the apical4 appears about 85-90% the size of a normal LA, and both vary with patient height. However, by MR, the RA is not smaller than the LA. The RA will dilate with pulmonary hypertension, ASD, tricuspid valve disease, right ventricular failure, and atrial fibrillation.
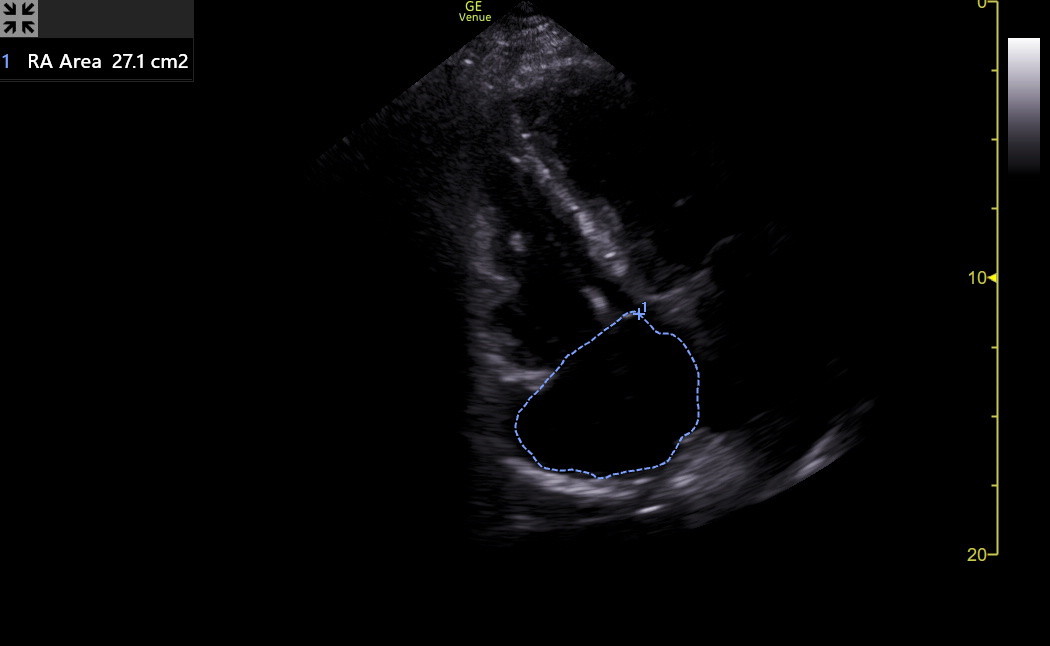
Often, if the LA has been measured, the difference between the RA and LA can be eyeballed. The RA should be measured if it is larger than a normal LA in the apical4 or SC4. Here is a giant RA seen in an older woman with severe TR.
The current best standard for RA size is RA volume, but this is impractical for IMBUS, and as noted above, RA volume is usually underestimated compared to MR. The IMBUS standard for RA size is the area, as shown in the following from the patient above with the enlarged RA. Using the previous LA size table for the RA is good enough.
RIGHT ATRIAL PRESSURE (RAP)
Doppler analysis of RV inflow was described as applicable when there was a question about RAP (Zaidi et al., Echo Research and Practice 2020; 7G19-G41). As shown in the basic RV chapter, obtain TV E with CW through the TV and TV e’ with TDI of the lateral TV annulus. TV E/e’ progressively greater than 6 indicates increasing evidence for elevated RAP. It is essential that E and e’ are obtained at the same phase of respiration. While inspiration would be ideal, the best views may be with expiration, and it is acceptable to get both values at the same phase of expiration. TV E/e’ could be followed during diuresis in a patient with right heart failure.
CHRONIC RAP INCREASE and THE CORONARY SINUS
The internal jugular vein and IVC are covered in another chapter as reflectors of RAP. The intrahepatic portal vein is discussed in the Liver chapter as a similar indicator of RAP. A final indirect marker of chronic RAP increase is a dilated coronary sinus. In the Heart Views chapter, a dilated coronary sinus was shown in the PLAX view. Another view is a modification of the apical4, with a modest posterior fan (opposite direction from the apical5). The LA begins to disappear, and the coronary sinus becomes a horizontal tube ending in the RA.
When the coronary sinus is greater than 1 cm in diameter, there is concern about RAP or the rare congenital persistence of the left superior vena cava. This is usually asymptomatic but can be associated with arrhythmias and is a concern with some cardiovascular procedures.
Here is a normal apical coronary sinus view.
This is an enlarged apical coronary sinus in a patient with chronic RAP increase.
Finally, the apical2 can also give an excellent view of the coronary sinus. The following clip is from a patient with moderate TR and a moderately elevated TV gradient. The coronary sinus is to the left of the lateral MV annulus. It measured about 1 cm, but the patient was a small woman, so it was likely dilated, indicating a chronic increase in RAP.