LV Size & Function
This chapter provides an overview of quantitative assessment of the left ventricle's size and both systolic and diastolic function.
LV measurements should be made toward the end of expiration when LV filling and output are maximal. A physician should direct a patient’s breathing to get the timing correct. Fortunately, most views of the LV are best toward the end of expiration. Heart size and function may vary with body height, so care is needed with very tall or short patients.
LV ENLARGEMENT
Detecting and quantifying LV wall enlargement with ultrasound is complex. Myocardial hypertrophy can result from hypertension, aortic stenosis, and hypertrophic cardiomyopathy. Diseases like amyloid, sarcoid, Fabry, and endocardial fibrosis cause wall enlargement from infiltration of non-myocardial tissue. Because most LV diseases are diffuse, we can focus our assessment and measurement on the end-diastolic, basal, inter-ventricular septum (IVS). However, some patients with hypertrophic cardiomyopathy can have hypertrophy only in the mid-ventricle or apex, and the basal IVS alone would be misleading in these patients. End diastole is the image with maximum LV chamber size, clearest and thinnest IVS, and the mitral valve just floating shut.
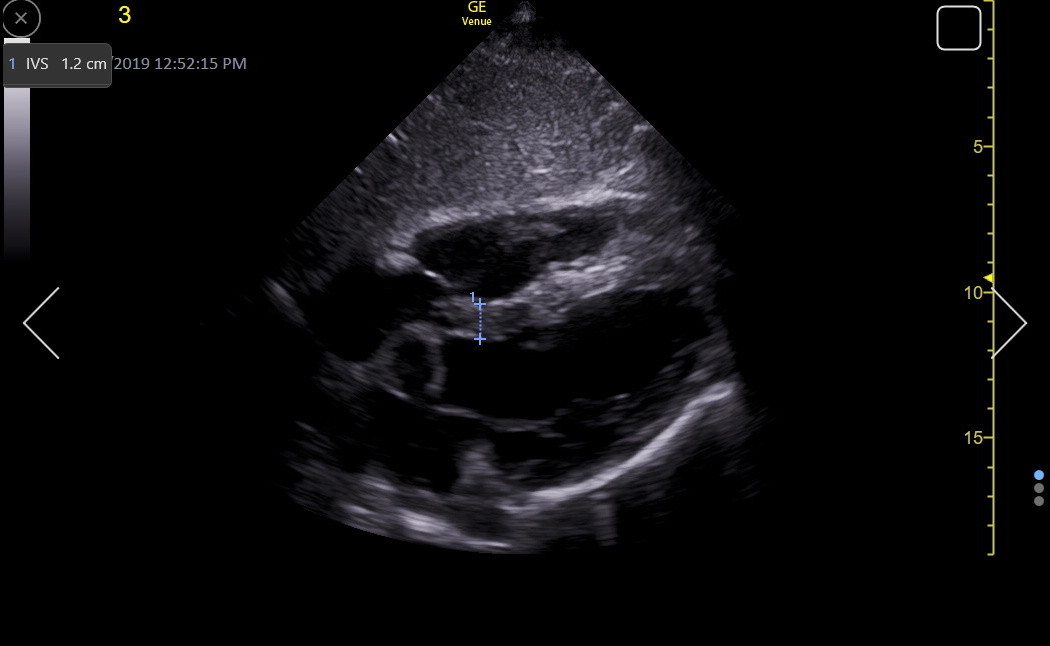
The PLAX is a standard view to measure the IVS, but it can be falsely low or high and needs confirmation from other views. Here is a good PLAX IVS measurement.
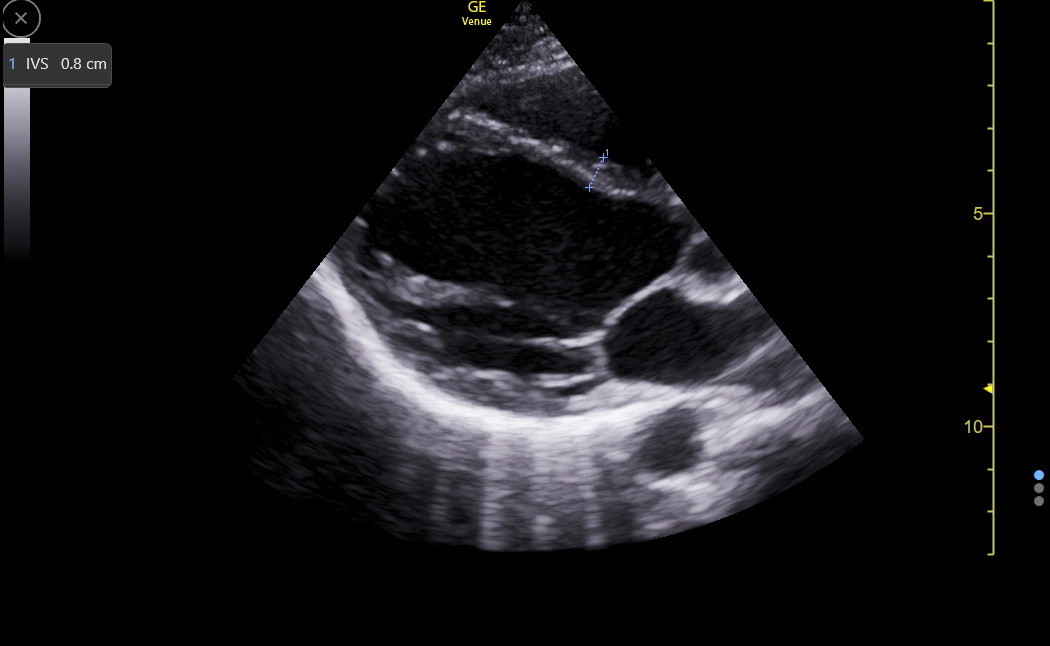
Here are the reference standards for the IVS in any view.
|
Normal |
Mild |
Moderate |
Severe |
IV septum (cm) |
0.6 - 1.1 |
1.2 - 1.3 |
1.4 - 1.6 |
≥1.7 |
The PSAX will not be a better view than the PLAX for measurement except that the inferoseptum can be measured explicitly if there is a concern that the anteroseptum is falsely wide because of the insertion of the RV moderator band. The following PSAX shows the moderator band joining the anteroseptum.
Here is a PSAX IVS measurement in the inferoseptum.

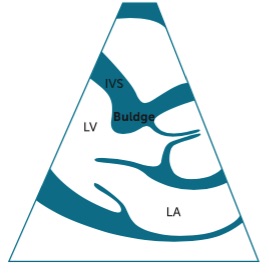
Discrete upper septal thickening (DUST)/sigmoid septum/septal bulge/septal knuckle is relatively common, especially in older patients. It is associated with hypertension but not hypertrophic cardiomyopathy and should be less than 3 cm in length. Here is a diagram demonstrating the abnormality. The IVS measurement should be distal to this bulge before the papillary muscles.
DUST is not entirely cosmetic. It can cause turbulence in the outflow tract (resulting in a murmur), and hypovolemia or hyper-catecholamine states may cause temporary obstruction of the outflow tract with systolic anterior motion (SAM) of the anterior leaflet of the mitral valve. Thus, SAM is not specific to hypertrophic cardiomyopathy. Here is a clip from a patient with a modest septal bulge but without SAM.

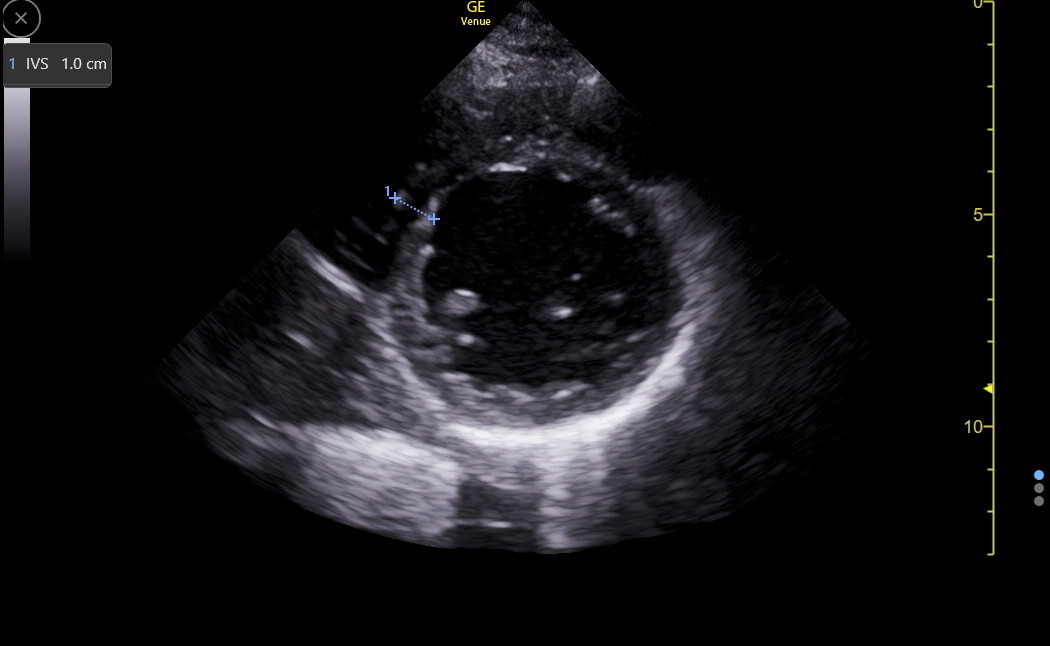
The apical4 may show the IVS clearly, particularly when RV enhancement is used to get the beam more perpendicular to the IVS. In a true apical4, the view is through the inferoseptum, so the moderator band is avoided. However, the lack of good endocardial resolution in this window, due to the ultrasound beam being mainly parallel to the endocardium, may result in under-measurement of the IVS. Here is an IVS measurement in an RV-enhanced apical4.
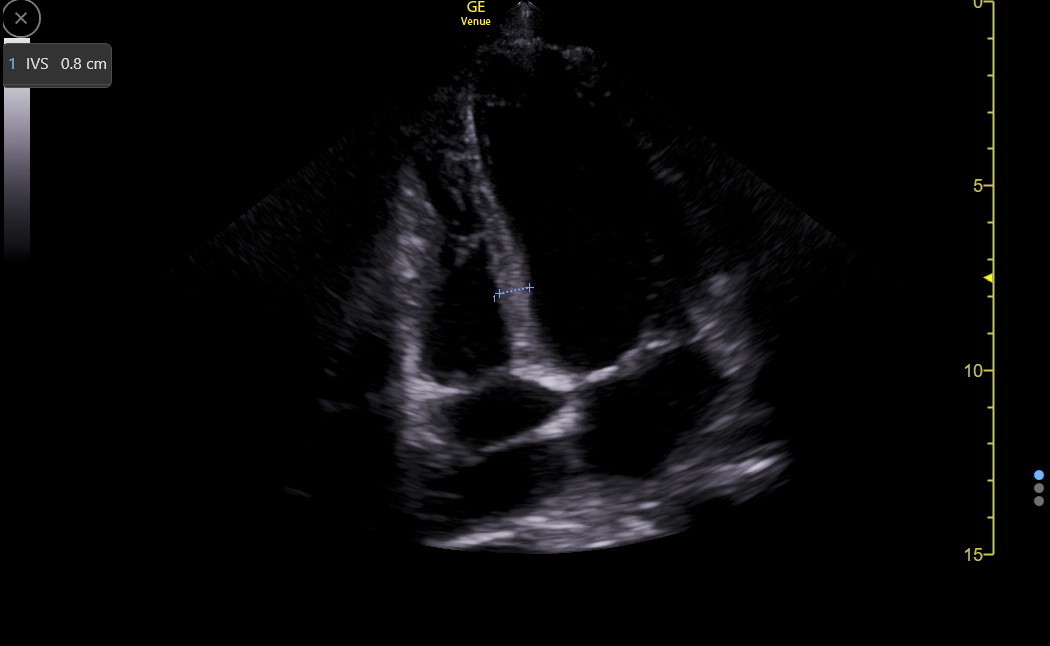
The SC4 view may be excellent for the IVS because the ultrasound beam is more perpendicular to the IVS. Here is a subcostal IVS measurement.
The IVS is not measured in every view when it is normal. However, an abnormal width in any view should be validated in other views to avoid overcalling septal enlargement.
LV End Diastolic Diameter (LVEDD)
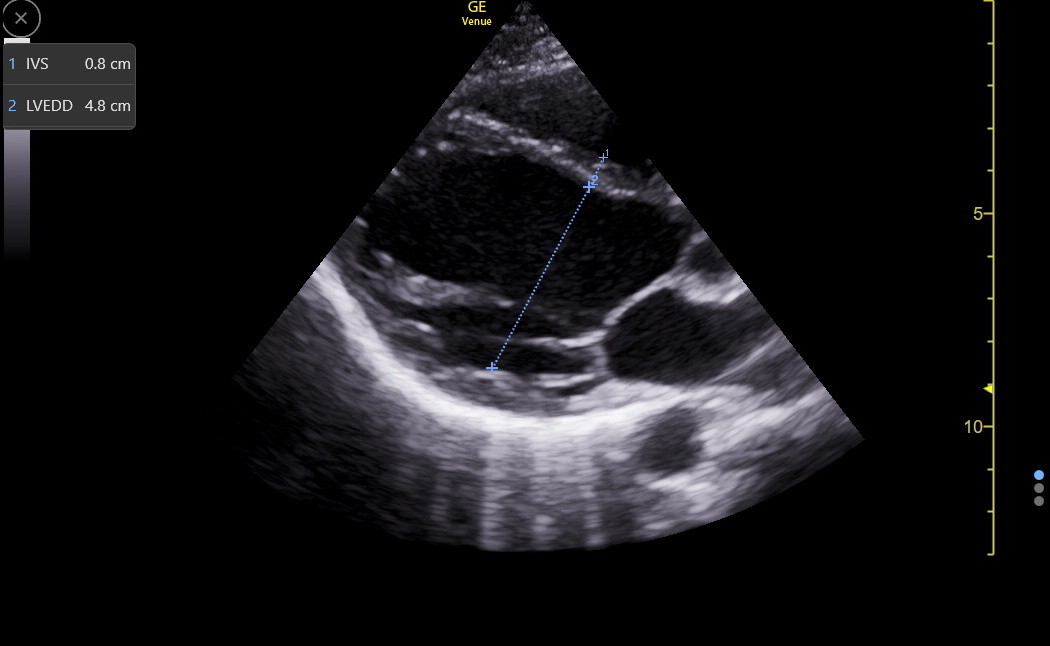
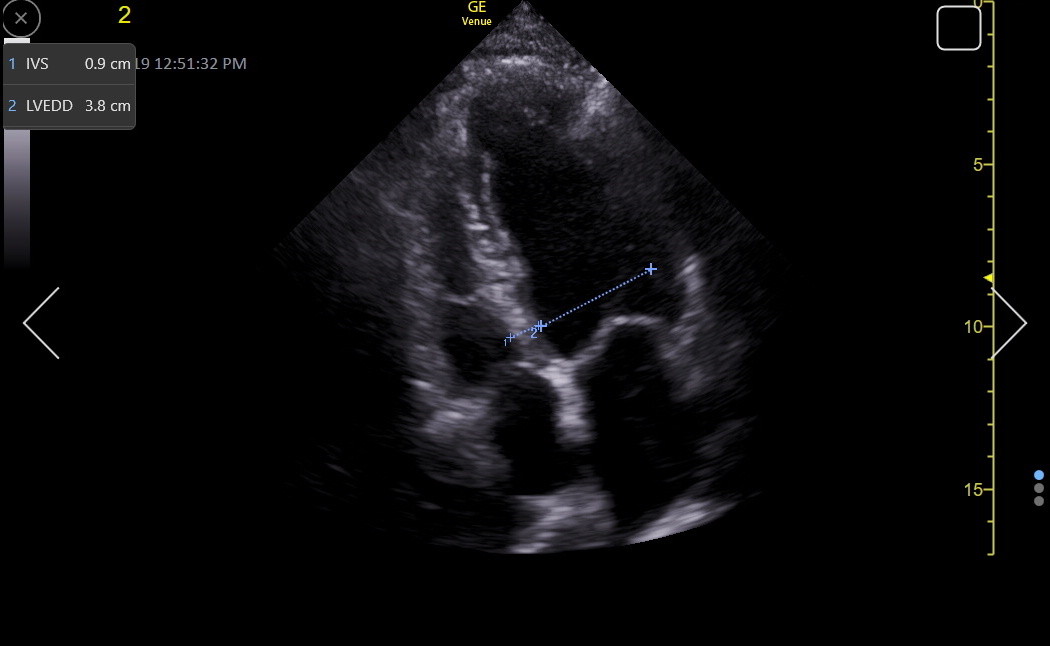
LVEDD varies with patient height and is measured from endocardium to endocardium in the same frame in which we measured the IVS. Observing the live B-mode images before freezing is essential to see where the chordal structures layer on top of the LV wall. The junction may be challenging to define in the end-diastolic frozen image, usually resulting in falsely low LVEDD measures. Next is a PLAX LVEDD measurement.
Here is an RV-enhanced apical4 LVEDD measurement.
As with the IVS measurement, a good SC4 may give the best LVEDD measurement because the ultrasound beam is perpendicular to the LV walls. Here is a normal LVEDD in the SC4/5.
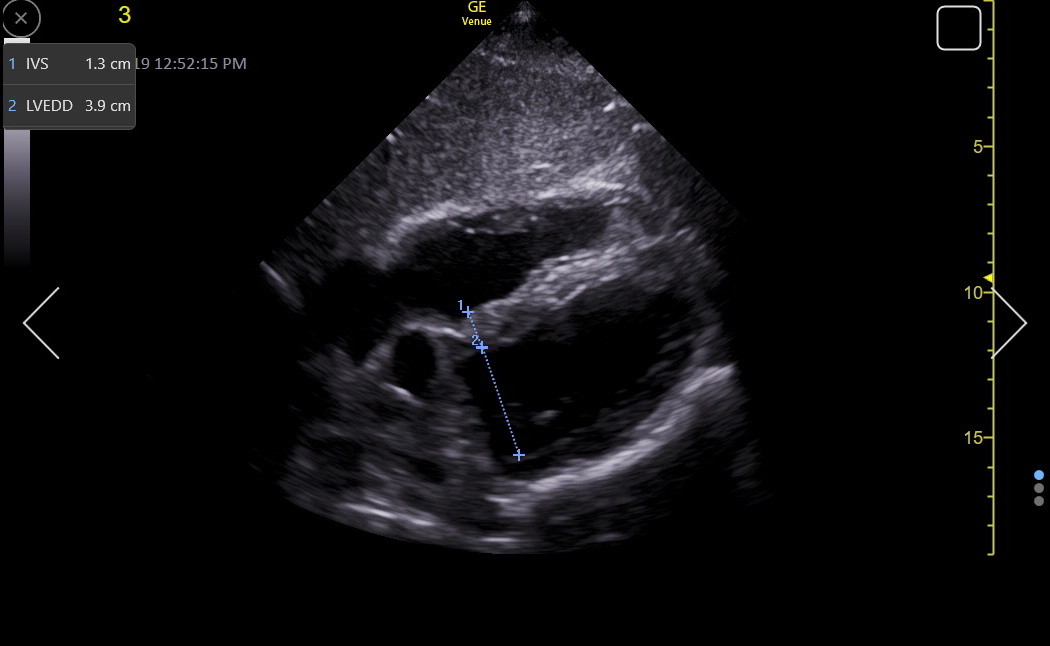
The LVEDD assessment must consider the patient’s height. Compared to MR volume calculation, echocardiography tends to underestimate LV size, especially in women.
Left Ventricle |
|
End Diastolic Diameter (cm) |
3.8 - 5.8 |
LV FUNCTION
LV function is a complex mix of wall thickening, inward (radial) motion, longitudinal motion, rotatory motion, and active relaxation (diastolic function).
E-point septal separation (EPSS) in the PLAX is a traditional M-mode screening measurement for the LV that we no longer obtain routinely with Venue because we have better tools discussed later. EPSS is affected by LV chamber size, diastolic function, left atrial pressure, and anterior mitral valve (MV) leaflet mobility. It measures the gap between the closest approach of the anterior mitral leaflet tip to the basal anteroseptum in early diastole, and we continue to visually assess this motion during our exams. M-mode through the end of the leaflets best visualizes this gap because of the higher frame rate. This technique can also detect systolic anterior motion of the MV (SAM), and we would obtain this M-mode tracing in patients with moderate or greater IVS enlargement or DUST. When it is challenging to get M-mode in-plane to the motion of the anterior leaflet toward the IVS, Venue has Anatomic M-mode that may give a more accurate measurement. The subcostal4 view may give better anatomic M-mode tracings across the MV and IVS.
EPSS is not a direct measure of systolic function. However, an abnormal EPSS is seen in most patients with significant systolic dysfunction because substantially reduced systolic function is almost always accompanied by reduced diastolic function. Conversely, a normal EPSS implies that systolic function is not much reduced.
|
Normal |
EPSS (cm) |
0 - 0.7 |
Radial function (squeeze) is often visually assessed, but this requires experience and an ability to integrate multiple views of the LV. The Simpson biplane method measures ejection fraction (EF) during formal echocardiography. This requires good views of the LV chamber in both the apical4 and apical2. On Venue, an automated Simpson single-plane EF measurement (Real-time EF) can be made in the apical4. It requires an acceptable view of the LV with the endocardium of both walls in view throughout a cycle. The app indicates the quality of the view by the color of the outlined endocardium (we want green). Here is a clip showing the app tracing the LV endocardium from which the EF is continually calculated as the percentage area change between diastole and systole.
Compared to biplane Simpson (normal range 52-72% in men and 54-74% in women), the single plane Real-time EF averages three percentage points lower. EF measurements are more accurate with increasing imaging quality. Real-time EF is superior to fractional shortening and visual assessment by most physicians, but it will be less accurate if LV wall motion abnormalities are present. EF is a popular measure but only part of LV function.
The Real-time EF application also calculates LV end-diastolic volume (LVEDV), which was, on average, about 14 mL lower than the biplane measurement. The normal range for LVEDV is wide (106-214 mL in men and 86-178 in women) because it is body size dependent. Formal labs divide the raw value by body surface area to create an index, but we rarely have an accurate BSA. We only use the LVEDV to help follow select patients for change in LV chamber size (e.g., chronic MR and AR).
Longitudinal Systolic LV Function: Although longitudinal function comprises only about 10% of overall LV systolic function, it varies depending on the region of the LV, and reduction in longitudinal LV function can be an early marker of various types of LV dysfunction. Mitral annular plane systolic excursion (MAPSE) with M-mode in the apical4 is the traditional way to assess longitudinal function at the septal base of the heart. However, it tends to measure falsely high. Tissue Doppler measurement of the annulus, as described in the next section, is more precise and at least as easy to perform.
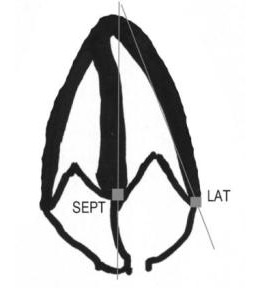
Understanding the location of the MV annulus is necessary for MAPSE and tissue Doppler imaging. The annulus is a ring of fibrous tissue (a little more hyperechoic than the myocardium) that supports the MV apparatus. On the screen, the septal part of the annulus in the apical4 view lies medial and a little apical to the base of the septal leaflet. It is not a particularly thick ring and is in continuity with the annulus of the aortic valve. The annulus lies vertically between the IVS and the interatrial septum and is passively moved by the myocardium in both chambers. The following drawing shows the location of the septal and lateral mitral annuli.
For MAPSE, the M-mode line needs to go through the septal annulus and be as in-plane as possible to the motion of the annulus. Position the cursor so it is best for end-expiration, activate M-mode, and freeze at end-expiration. Find the best complex and measure the difference between the peak and valley of the movement. This measurement can require judgment about where to place the calipers. Longitudinal function usually decreases modestly with age, probably in concert with the development of diastolic dysfunction.
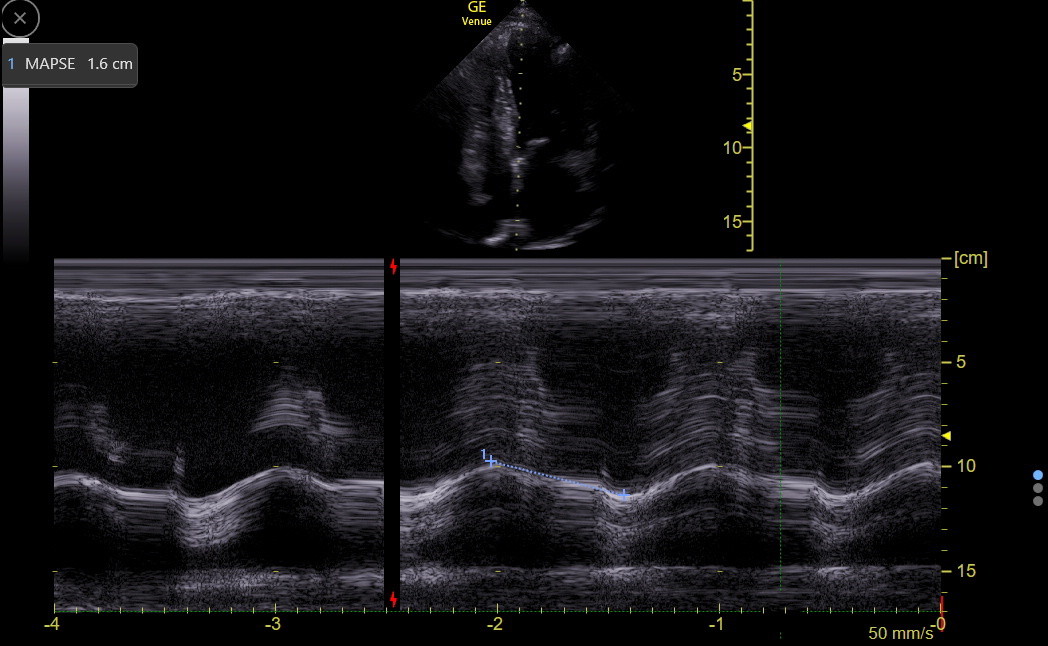
|
Normal |
MAPSE (cm) |
1.2 - 1.8 |
TISSUE DOPPLER (TDI) ANALYSIS OF THE MITRAL ANNULUS
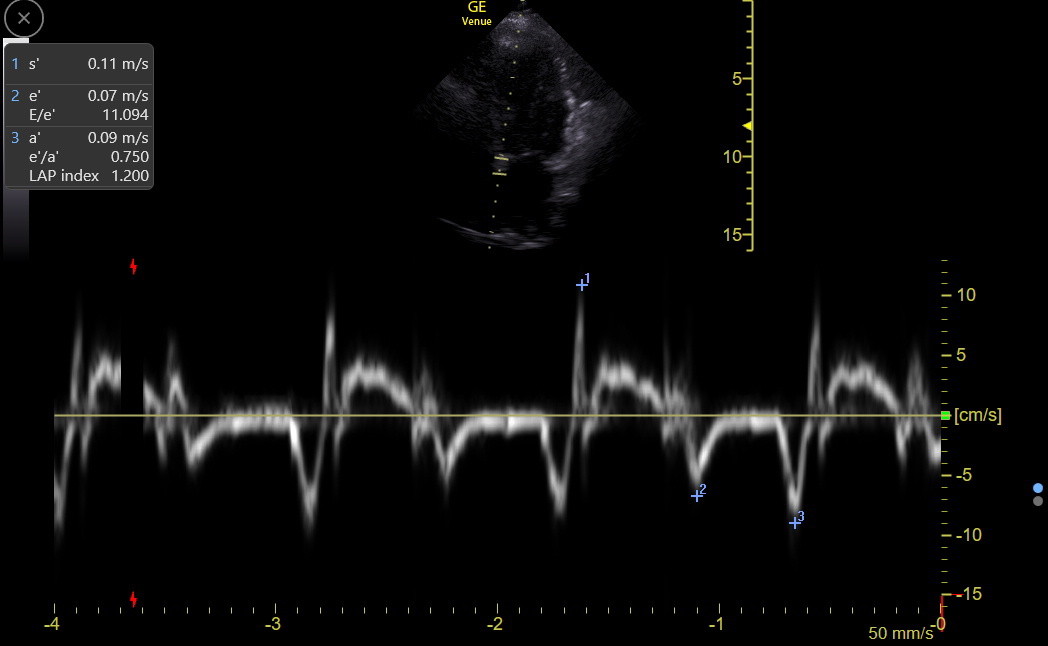
This uses PW to measure the velocity of movement of the mitral annular tissue, including the positive s’ (longitudinal systolic function), negative e’ (active relaxation of diastolic function), and negative a’ (atrial contraction) waves. For PW TDI, the gate must be carefully placed in the annulus's center and parallel to its movement. The first gate target is the septal mitral annulus, which on the screen is the hyperechoic nubbin of tissue medial and a little apical to the base of the septal leaflet. Be sure to fan anterior and posterior to find the brightest and clearest annulus.
Step 1: On Venue, the standard PW gate is first positioned over the mitral annulus for the best location at end-expiration. Be sure to fan anterior to posterior to get the clearest annulus during expiration. Then, angle correction is used to get parallel to the annulus's motion.
Step 2: After the gate is positioned, activate TDI. The complex size rarely needs to be changed, but the sweep speed periodically needs to be adjusted to show only 3-4 complexes on the screen. Freeze at the end of expiration, pick the complex with the clearest, most negative e’ wave, and measure s’, e’, and a. The following is a good TDI tracing with measurements.
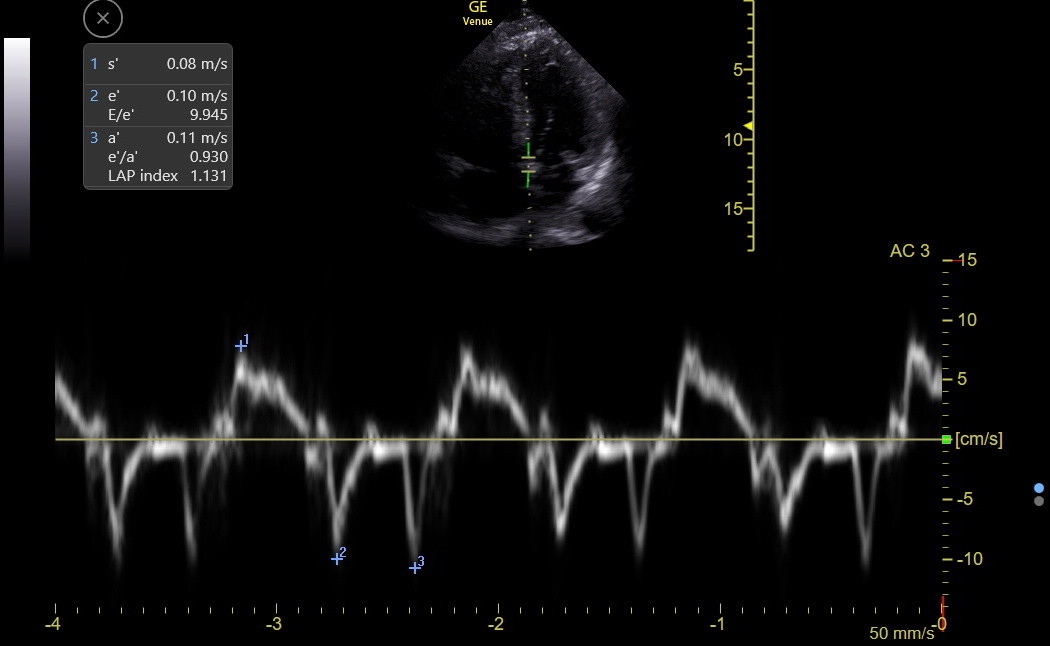
The s’ is a better longitudinal systolic LV function measure than MAPSE and is our standard with Venue. The s’ usually falls modestly with age but stays ≥ 0.07 unless some cardiac disease occurs. This cutoff applies equally to the septal and lateral mitral annuli, although the lateral s’ is often modestly higher than the septal.
Traps: There is a part of LV contraction called isovolumetric contraction (IVc), which occurs in earliest systole when the aortic valve is still closed. No change in LV volume occurs during this very brief event. The IVc can be seen in the TDI tracing above and is the initial brief up and down deflection right before s’. There is no IMBUS utility in measuring the usually small IVc peak or duration. However, the following TDI tracing demonstrates what can happen when the IVc is prominent. The physician chose the IVc peak of 0.11 as s’ when the true s’ peak was about 0.06.
There is also a deflection after s’ and before e’ that can be seen in both TDI tracings above. This is isovolumetric relaxation (IVr), occurring between aortic valve closure and mitral valve opening. Don’t confuse this deflection with e’.
Equivocal or low e’ values should be repeated with careful attention to gate placement. Atrial fibrillation patients have e’ values, but they can vary from beat to beat. The recommendation is to average about five complexes, and this is tedious. But it may be worth obtaining the tracing to identify a patient with consistently low e’. The e’ can be measured, but is not reliable, when there is significant mitral annular calcification, previous mitral valve repair or replacement, abnormal basal septal wall motion, pacemakers or left bundle branch block, significantly impaired right ventricular function, or ≥ moderate mitral regurgitation. TDI of the lateral mitral annulus avoids a few of these problems, and we always use it to confirm low septal TDI measurements. We also measure lateral annulus TDI in any patient with symptoms that might be heart failure because it can be a crucial marker of constrictive pericarditis, as described in the chapter on left heart failure.
The table below is for the septal annulus. The lateral annulus e’ is always higher by about 0.03 m/sec (unless the patient has constrictive pericarditis), and the lateral s’ and a’ are often slightly higher.
Mitral Annulus TDI |
16 - 20 yr |
21 - 40 yr |
41 - 60 yr |
> 60 yr |
s’ (m/sec) |
≥0.07 |
≥0.07 |
≥0.07 |
≥0.07 |
e’ (m/sec) |
0.12 - 0.17 |
0.13 - 0.18 |
0.10 - 0.14 |
0.07 - 0.12 |
a’ (m/sec) |
-- | 0.07-0.10 | 0.08-0.12 | 0.09-0.12 |
LV OUTFLOW/CARDIAC INDEX
PW can assess the flow through the left ventricular outflow tract (LVOT). This flow is away from the probe, appearing below the zero line, as in the following tracing.
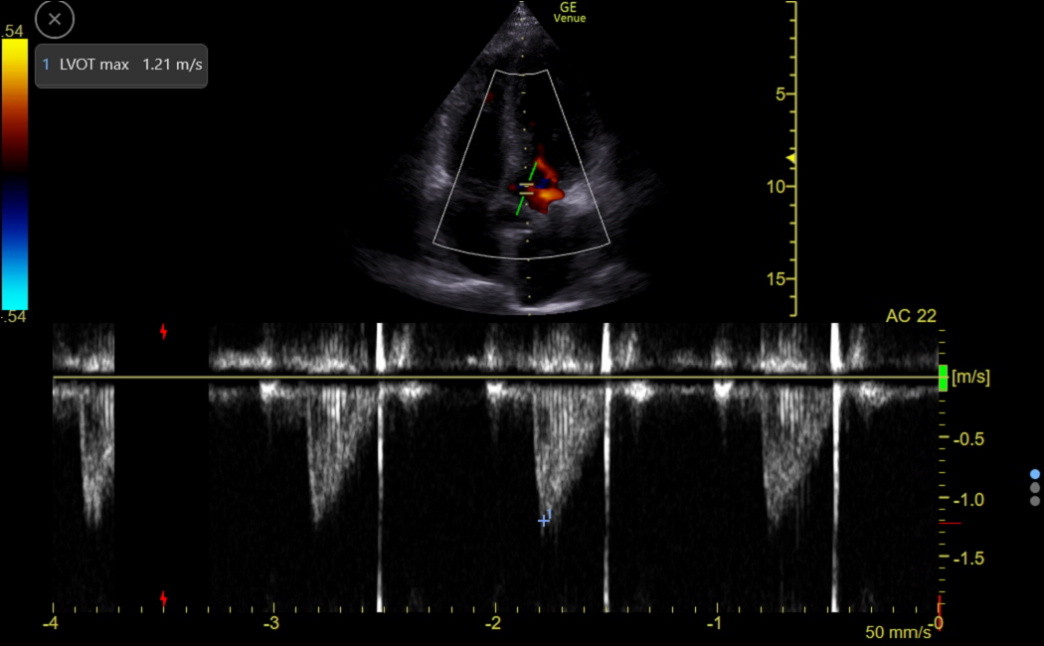
We need the area under this flow curve, called the Velocity Time Integral (VTI), to estimate the cardiac index. VTI (cm/stroke on Venue) varies with heart rate. The measurement can be false with ≥ moderate aortic regurgitation or conditions with SAM.
Venue automates obtaining the VTI with an app called Auto-VTI, which functions well with an acceptable or better apical5 or apical3. The app places a region of interest (ROI) box over the distal LVOT and looks for a correct PW waveform, including flow laminarity. The gate will not be at the valve where turbulent flow can occur. Following the traditional manual echocardiography convention, the app does not angle correct the PW gate. Therefore, get the LVOT less than 30 degrees off-vertical for accurate measurements. The app traces each stroke and recalculates every 2 seconds. The color of the ROI box indicates the quality of the view, and when a green box occurs, freeze at end-expiration to obtain the final output, as follows.
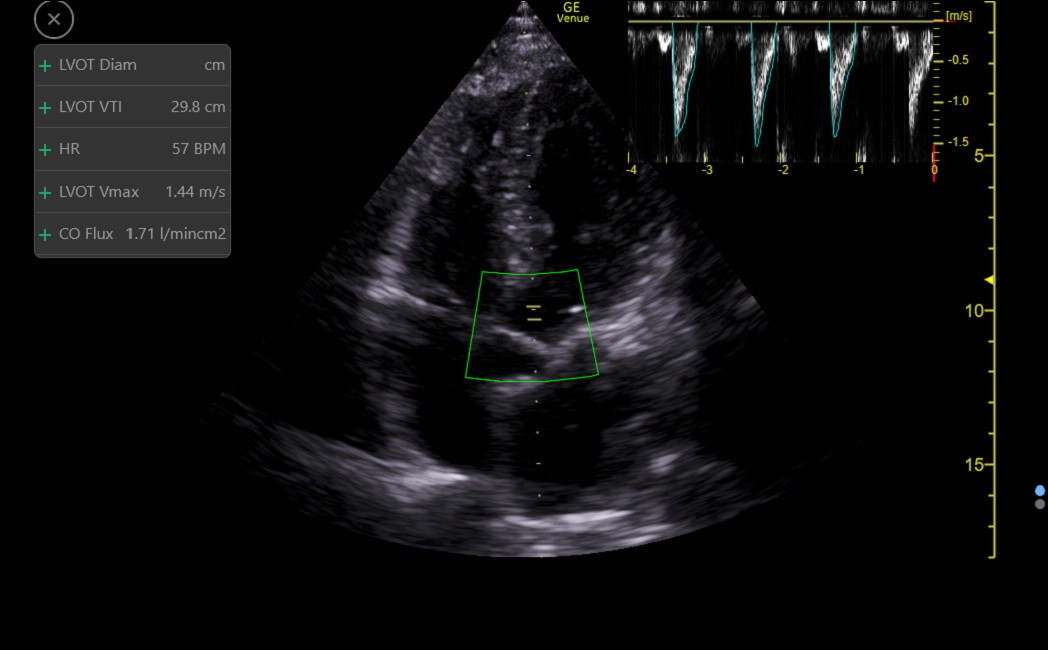
The app reports the VTI, HR, and a calculated surrogate of cardiac index called the CO Flux (VTI x HR)/1000) (the units don’t matter). CO Flux is independent of patient gender and size while correlating strongly with the standard body surface area corrected Cardiac Index. The average value for CO Flux is 1.5, and the normal range is from about 1.0 to 2.0. Patients below and above this range would be categorized as having low and high cardiac index.
A NOTE ABOUT THE ATHLETES HEART:
This condition usually results from prolonged, intensive endurance training. The septum is rarely over 1.3 cm, and the right and left ventricles may be slightly above normal diameter. Radial LV function can appear low normal by eyeball and even by EF, but just having a patient squeeze a ball hard can improve the radial function. Specific LV longitudinal and diastolic function is normal to supra-normal in these athletes, eliminating the eyeball concern about reduced LV function.